R package misc: For everyday analyses!
09 Oct 2018Summary
I wrote my first R package that contains some useful functions I use on a daily basis. I got tired of loading them in my working environment every time so I decided to make an R package. Here is a summary of the functions version 0.1.0 contains:
write_excel- copies data frame to clipboard which makes copying data easy, e.g. to Excelparametrized_query- parametrize SQL query.analyse_var- analyse variable depending on AB test groupnp_mean_test- non-parametric bootstrap test of meannp_stat_test- non-parametric bootstrap test of any statisticssplit_per_group- splits variable from one column into list of vectors depending on any other variable e.g. AB test groupget_value- for a function defined by points return value for an x
Hope you find them useful!
Installation
This package is avalilabe through GitHub. You will need package devtools to install it.
#If you don't have devtools package
install.packages("devtools")
library(devtools)

# If you have devtools run from here
install_github("eliobartos/misc")
library(misc)
To read my beautiful documentation run
help(package = misc)
Next I will show you how to use some functions from misc package and how they came to life.
write_excel
How many times did you need to copy some data from R into Excel? Did you copy it from the console, or did you use View() and then copy it? Well I did it like that at the beginning and it was awful. Then with some quich Google search I found this to be really good way to copy data to Excel or anywhere you want. Just add this function at the end of your pipeline and it is like you pressed CTRL+C, go to Excel and press CTRL+V.
data(mtcars)

mtcars %>%
  group_by(cyl) %>%
  summarise(hp = mean(hp)) %>%
  write_excel()
More logical name for this function would be copy_to_clipbord or ctc for short, but I like write_excel because I’m used to it now, and I mostly copy to Excel, when I don’t have time or need to write R Markdown reports.
parametrized_query
If you want to run SQL query with parameters, this function changes all ‘x1x’ to first parameter in list, ‘x2x’ to second parameter in list and so on. It basically takes string and replaces it with a new string ready to be sent to the database.
query = "
select date, sum(revenue) as revenue
	from my_sample_table
	where date between 'x1x' and 'x2x'
	group by 1
	order by 1;
"
p_query = parametrized_query(query, c('2018-09-01', as.character(Sys.Date())))
cat(p_query)
This is the query you get:
#Output
> select date, sum(revenue) as revenue
> from my_sample_table
> where date between '2018-09-01' and '2018-09-30'
> group by 1
> order by 1;
analyse_var
For the next few functions we will use this simple dataset as an example. I love using it with the pipe notation.
library(tibble)
library(magrittr) # To load pipe %>%
df <- tribble(
  ~x, ~group,
   1, 1,
 3.2, 1,
 2.4, 1,
 3.1, 1,
   5, 2,
   6, 2,
 4.7, 2
)
It contains data for some measurement x for two different groups. Function analyse_var quickly analyses variable x by groups in column group. It returns one graph and two tables.
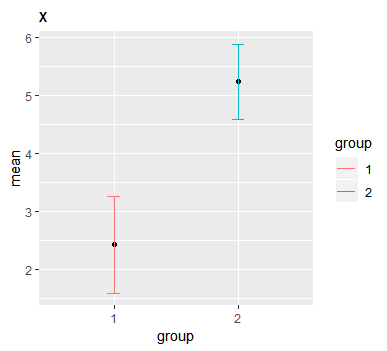 Graph plots mean by groups with confidence interval. Default is 90%.
$`quant_data`
# A tibble: 2 x 6
  group   q05   q25   q50   q75   q95
  <dbl> <dbl> <dbl> <dbl> <dbl> <dbl>
1     1  1.21  2.05  2.75 3.125 3.185
2     2  4.73  4.85  5.00 5.500 5.900

$mean_data
# A tibble: 2 x 6
   group     mean        sd        se    lower    upper
  <fctr>    <dbl>     <dbl>     <dbl>    <dbl>    <dbl>
1      1 2.425000 1.0144785 0.5072393 1.590666 3.259334
2      2 5.233333 0.6806859 0.3929942 4.586915 5.879751
We also get two tables. First one is an easy way to compare quantiles. Second one is basically data that is in the graph, showing mean, standard error and confidence intervals.
split_per_group
If you have data in the tidy form like we have above in df, sometimes you just need vector for each group of data. Some functions for statistical tests don’t accept formula input and you can’t do something like this:
# Formula Input
statistical_test(x ~ group, data = df)
They expect input like this:
# Vector input
statistical_test(x_data, y_data)
Function split_per_group splits data in exactly this way.
out = df %>%
  split_per_group('x', 'group')

statistical_test(out[[1]], out[[2]])
In addition you can also drop top percentage or any number of users from both vectors. This may be useful when analysing very skewed distributions. You can also set top x percentage of values to the maximum of all other values, to reduce the skew.
np_stat_test, np_mean_test
This test enables you to test difference between two groups in any statistics of interest (mean, median, other quantiles, standard deviation…). This is basically non parametric bootstrap test.
Idea is simple, gather all observations together (both vectors) and sample from that vectors of the same sizes that we got. Calculate statistic of interest for each group. Calculate difference in statistic. Then repeat the proces many many times, to get manny differences. Then compare our observed difference with distribution of differences that we got.
The idea is to simulate that vectors come from the same distribution. We do that by gathering them and drawing vectors from the same distribution. If the difference we observed is very unlikely given the distribution of differences that we got then that difference is meaningful and that statistics of interest is different in groups. Conversly the distributions are differnt.
Continuing our example with data df:
out = df %>%
  split_per_group('x', 'group')

np_stat_test(out[[1]], out[[2]], mean)  # Same as np_mean_test(out[[1]], out[[2]])
np_stat_test(out[[1]], out[[2]], median)
np_stat_test(out[[1]], out[[2]], quantiles, prob = 0.25)
Function returns p-value, number of simulations it ran, observed difference and simulated differences. It also shows a plot like this:
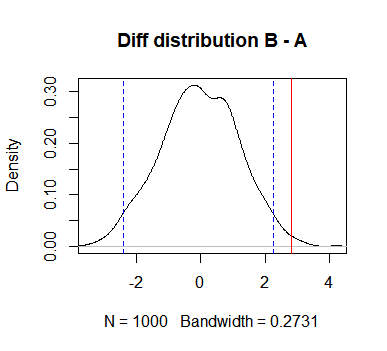
Plot shows observed difference and 95% confidence interval for differences. If observed difference is outside you can be a little more sure that there is some difference between groups.
I don’t use this function for rigorous statistical testing. Often when doing analyses you think of some metrics that represent how good a certain group is. But these metrics can be completely made up and hard to explain which difference between groups is big or small. Then I use this test to get some idea is the difference real or not. I also explore different statistics because often distributions are very skewed. Think of for example amount of time someone spends on your web site, or amount of money people spend. I use this function to explore.
First version of this function was np_mean_test which did the same thing for calcuating the mean. But then I realised, why not do this for any statistics of interest. Then np_stat_test was born. I don’t plan on updating np_mean_test function.
get_value
If you have a linear or step function defined by points, and remember: any function can be approximated by linear functions, this functions gets you value for some x.
library(tibble)

df = tribble(
~x, ~y,
 1, 1,
 5, 5,
 10, 10
)

get_value(df, 2)           # returns 1
get_value(df, 2, "linear") # returns 2
I won’t tell you why I wrote this function but I use it very often when doing some simulations, when I’m trying to set some parameters or model something.
Thanks for reading! I hope you find some of these functions useful in your own work!